Blog
Insights from the RODA team
Friday, June 27, 2025
Explore 2025 tech trends for UK small businesses, including AI tools, automation, digital transformation, passkeys, Google AI Overviews, and new compliance rules. Based on real survey data from SME owners.

Tuesday, May 6, 2025
Discover the top 5 reasons to choose Shopify Hydrogen for your next e-commerce project — from lightning-fast performance to seamless Shopify integration and developer-friendly features.
Monday, January 27, 2025
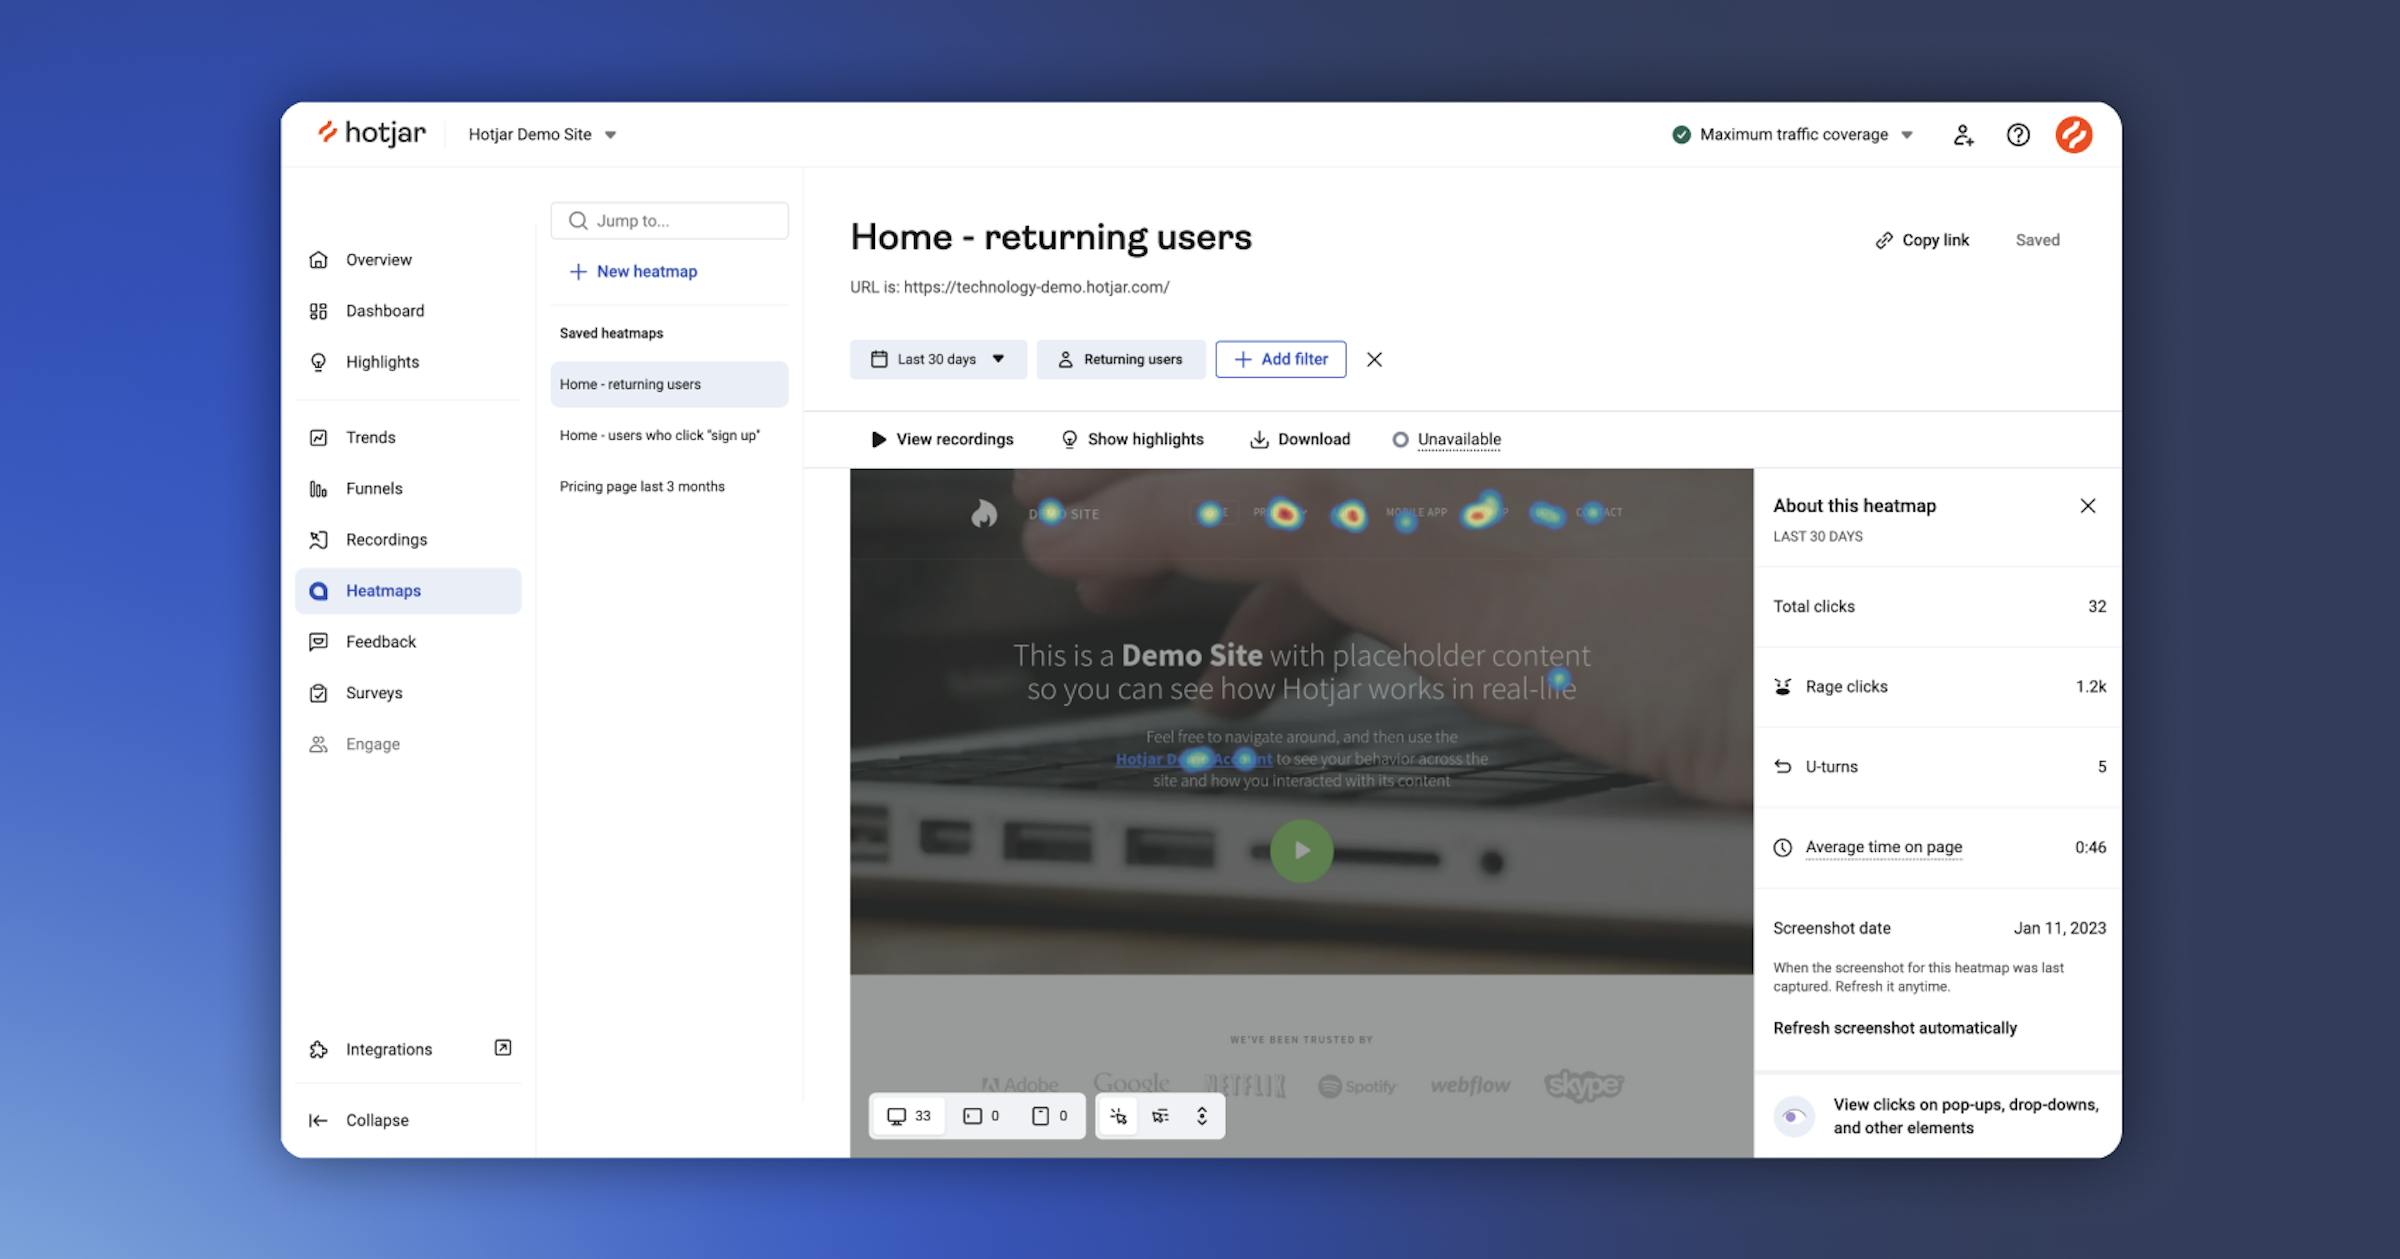
Discover how HotJar’s heatmaps, session recordings, and surveys unlock user behaviour insights to optimise conversions. Partner with RODA Technology for expert implementation and tailored data-driven marketing strategies. Start now!

Monday, April 29, 2024
Our collaborative analysis with TBL Group on the MRV data for 2022 reveals that the global shipping industry faces significant financial exposure to carbon markets, estimated at £9.6 billion. Additionally, the industry was responsible for emitting 137 million tonnes of carbon in 2022. This insight underscores the sector's critical role in both economic and environmental landscapes.
Sunday, January 28, 2024
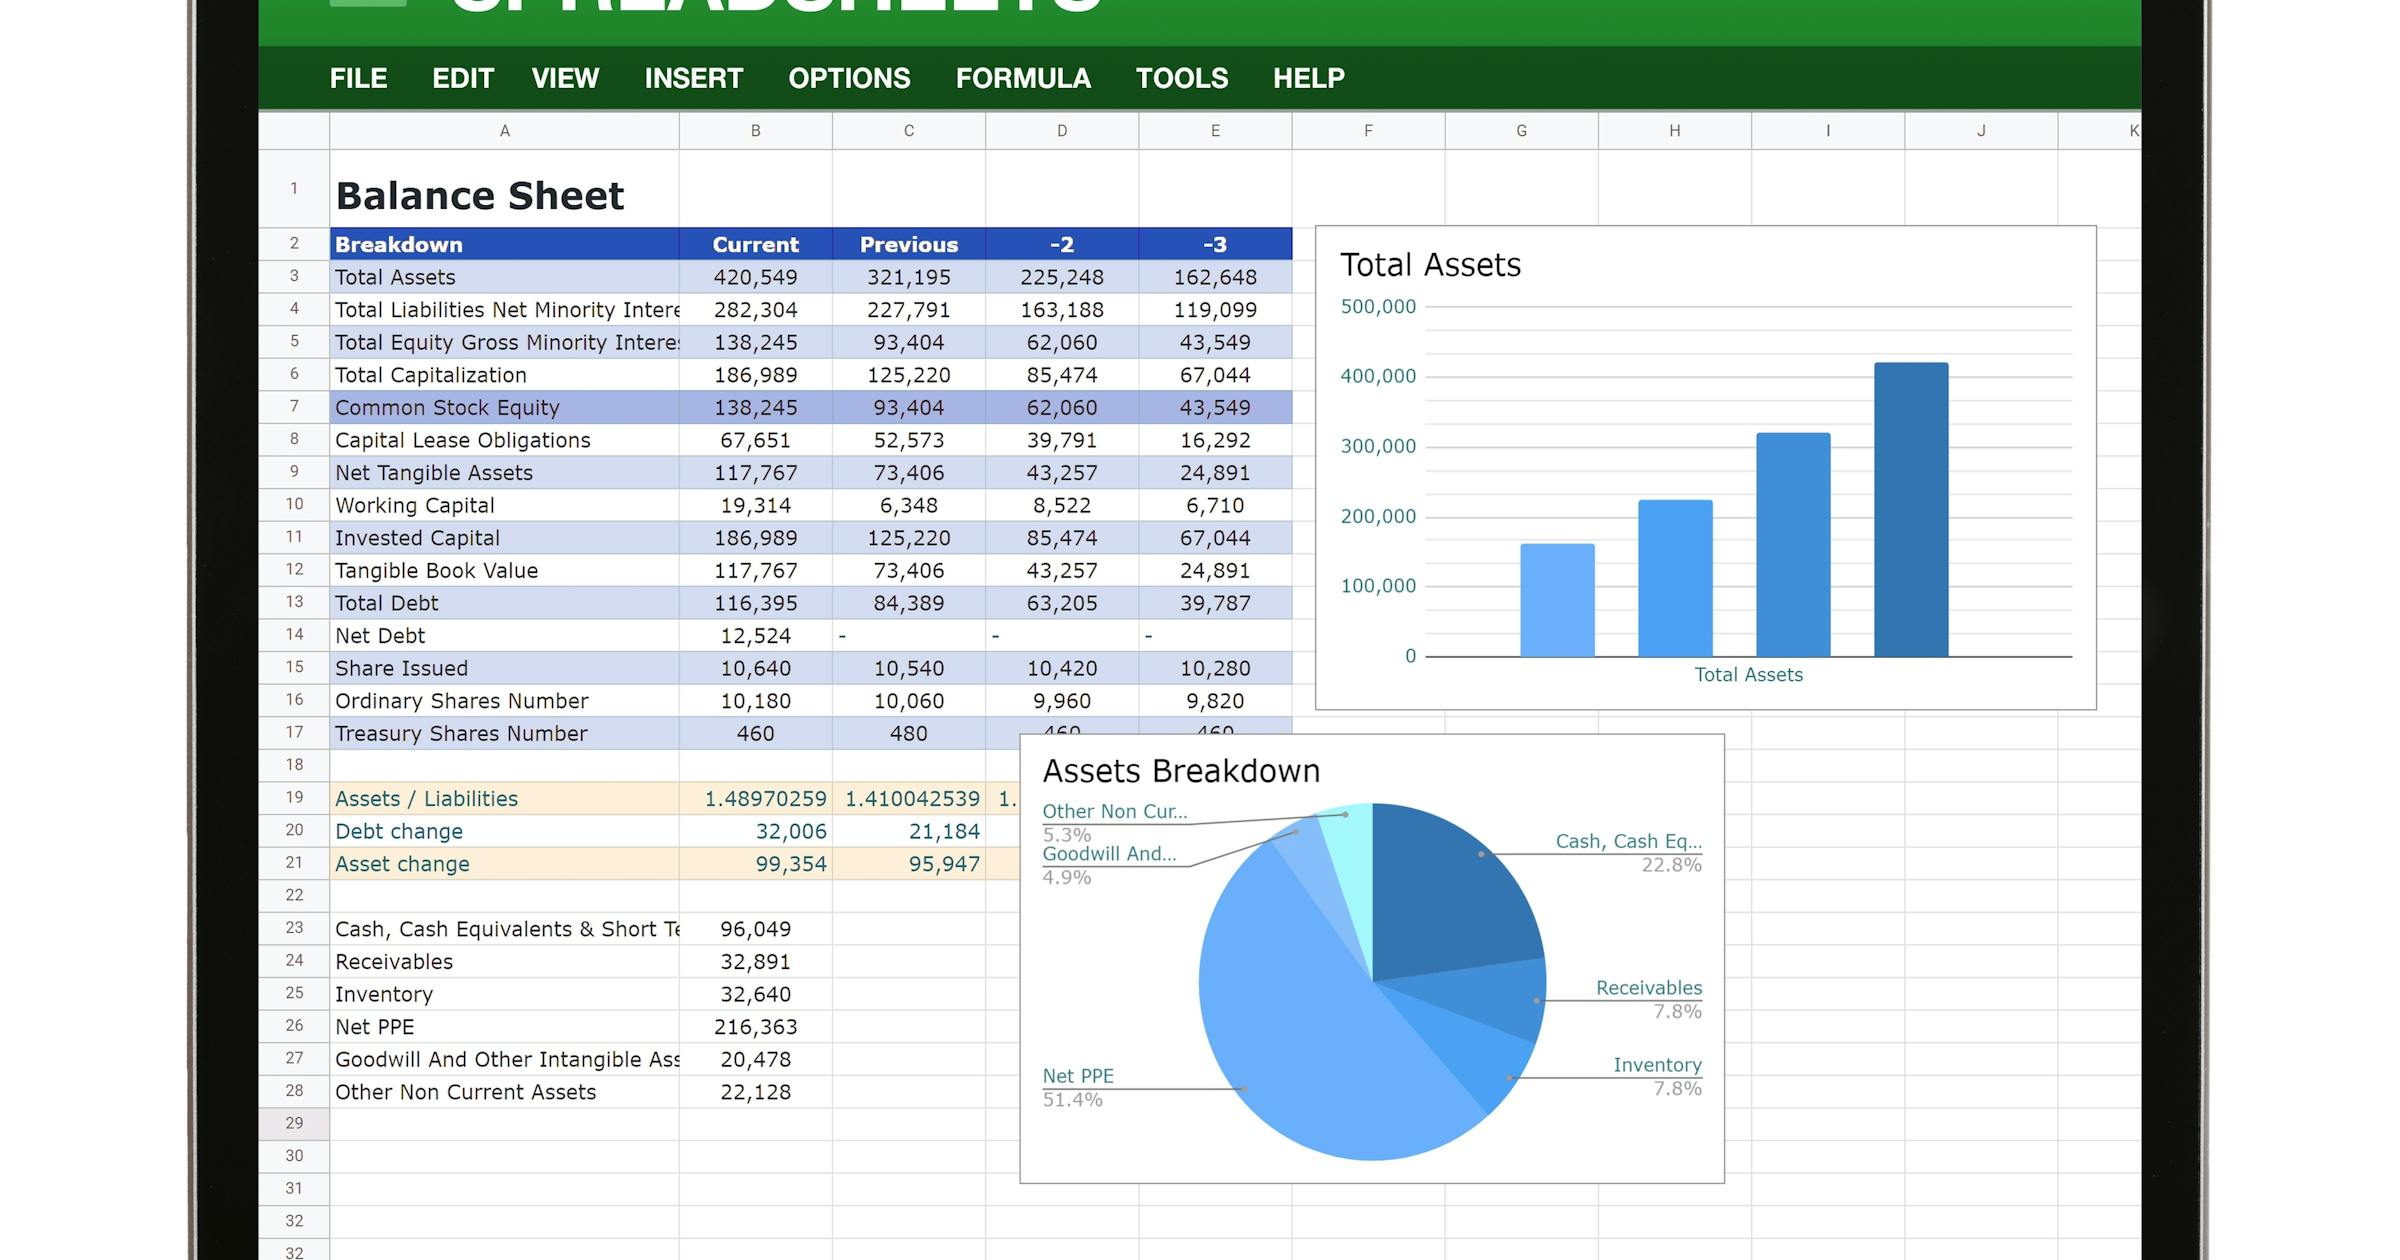
Microsoft Excel is a versatile tool that offers a wide range of functions and features for data analysis. One such function that proves invaluable, especially in education, is the LINEST function. LINEST, short for "Linear Estimation," is a powerful statistical function used for linear regression analysis. In this blog post, we'll delve into what the LINEST function does, how to use it effectively, and explore some compelling use cases in the field of education.
Tuesday, December 12, 2023
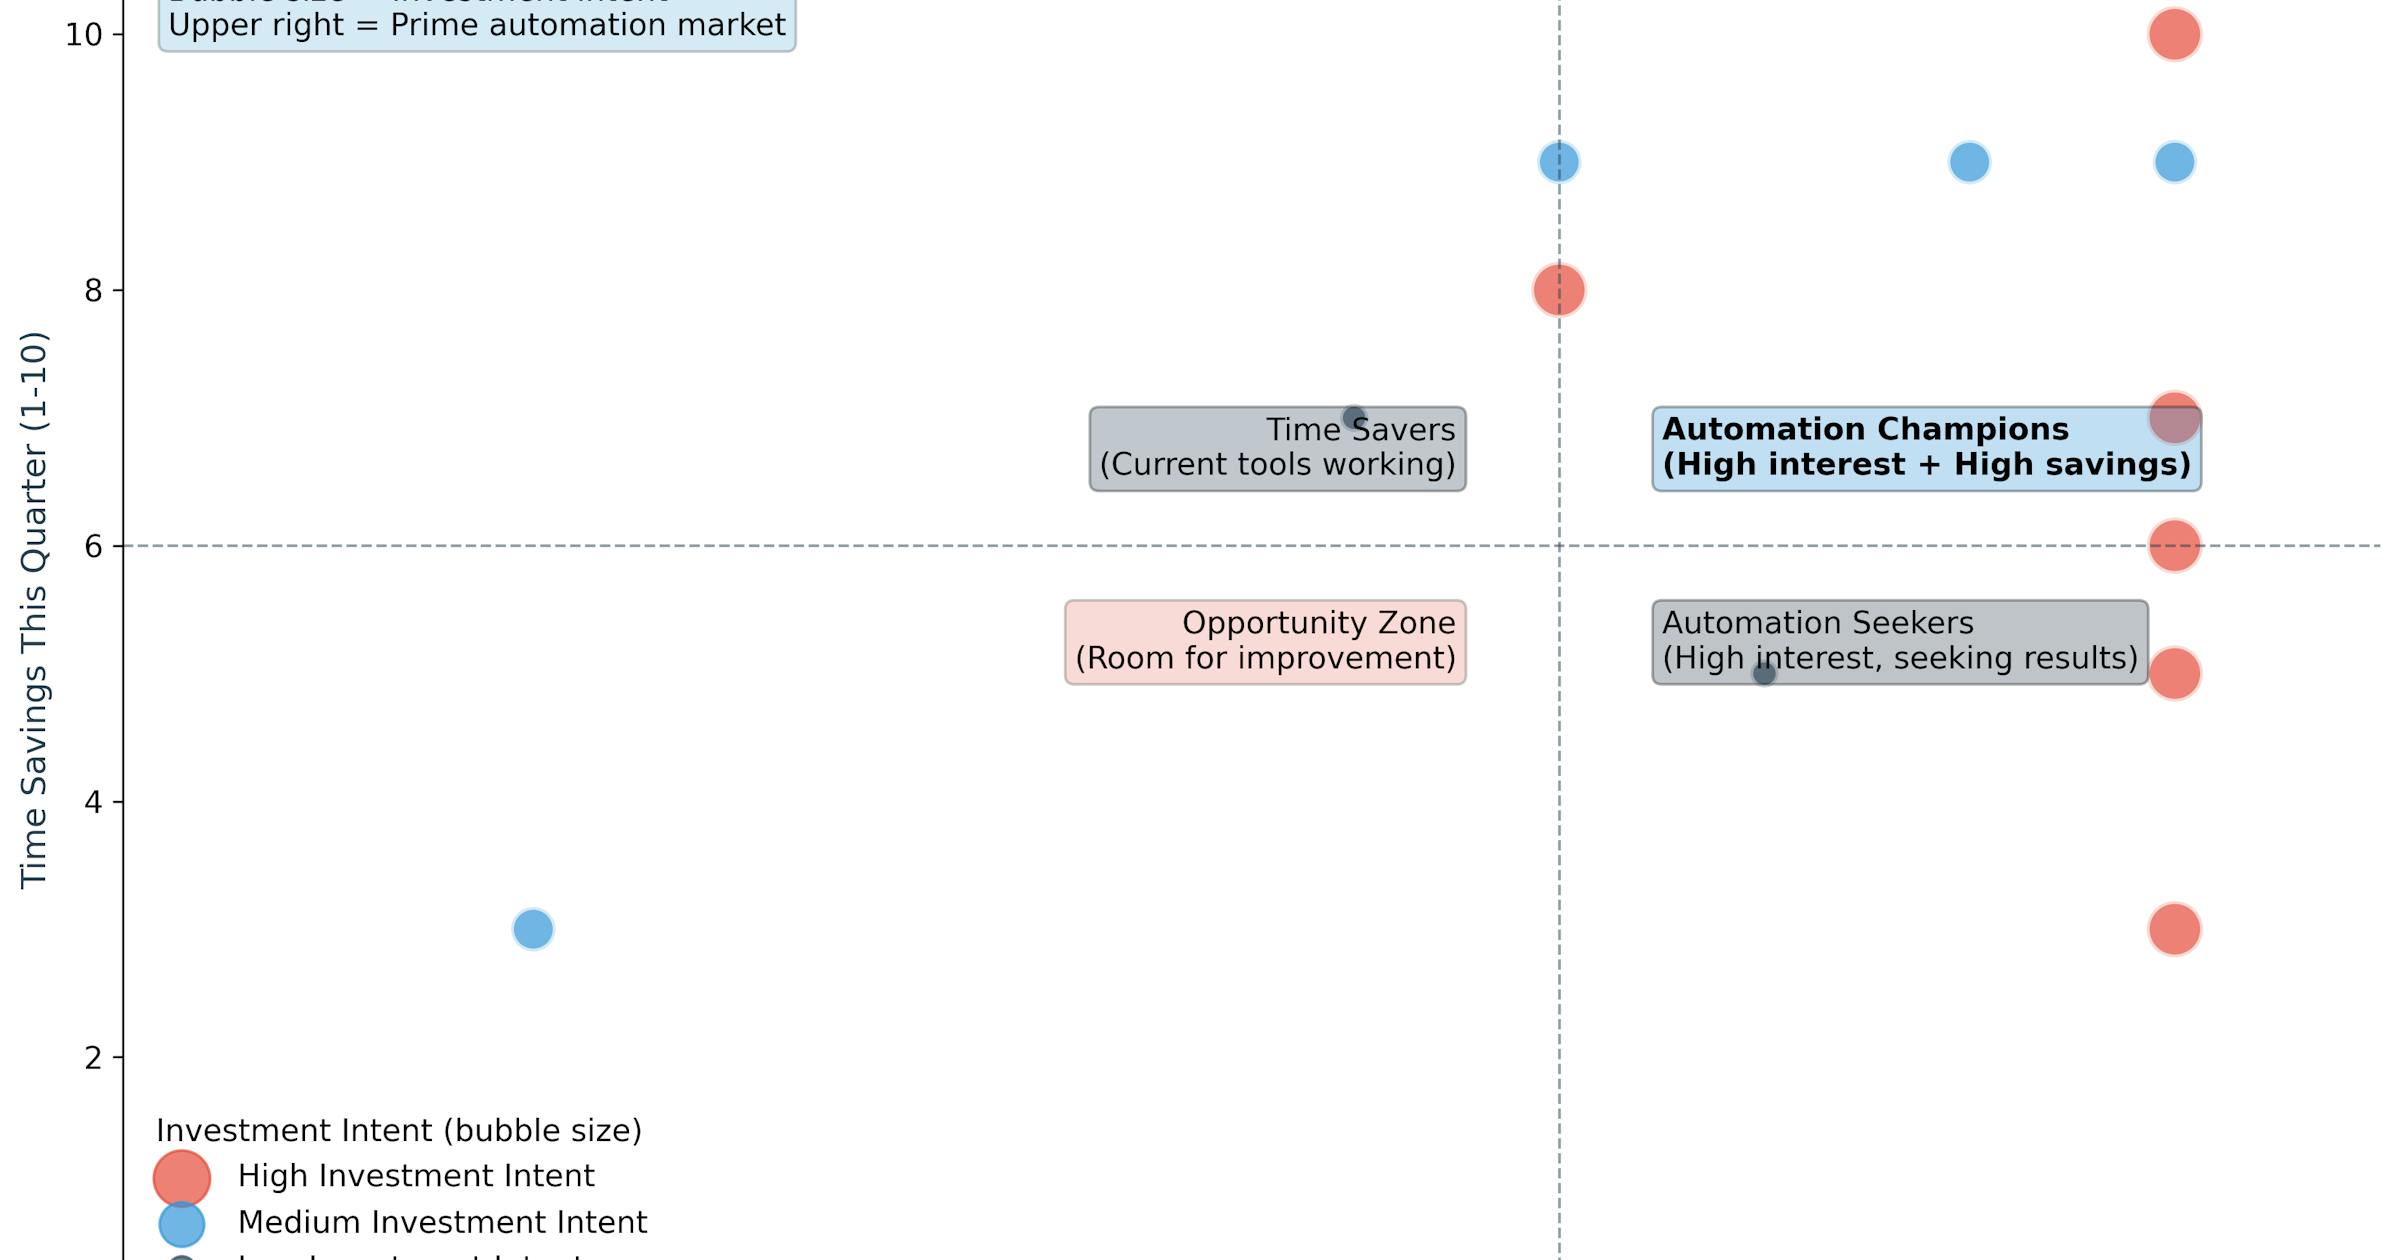
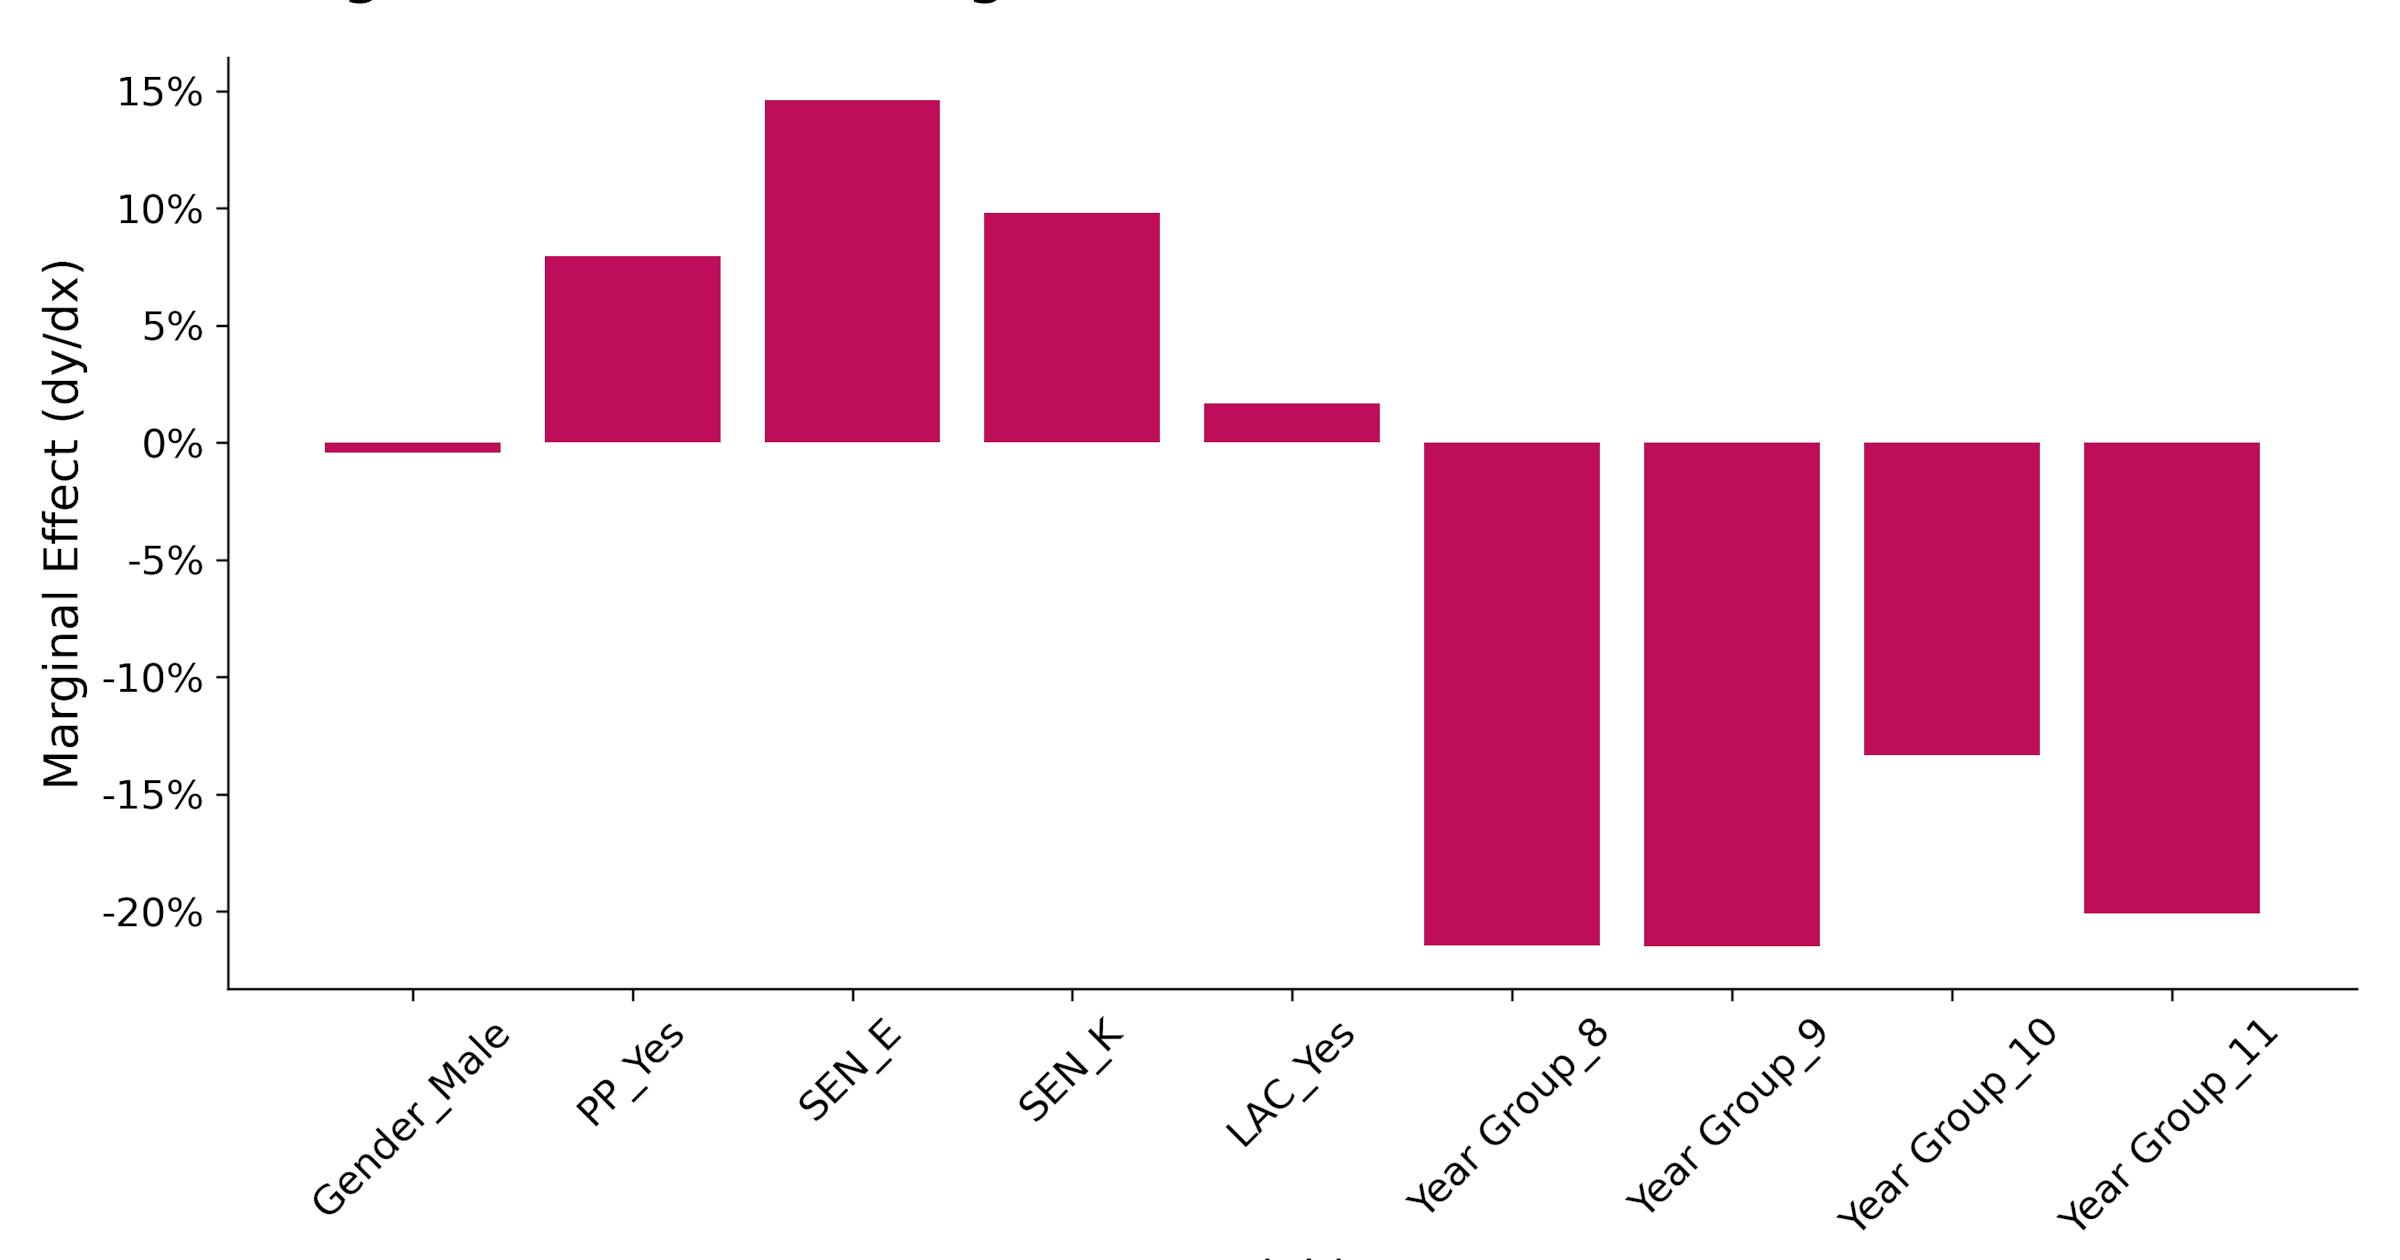
We used historical patterns to explore students who are at higher risk of multi-day absences.

Saturday, December 9, 2023
The "Climate Change Impacts on Cultural Heritage" report, authored by Triple Line Consulting, presents crucial insights into how climate change is affecting cultural heritage globally.